Architecture
The iXZepta Engine
Before the meeting, everyone has a view. After it, everyone has agreed. The gap between those two moments is where decision risk hides. iXZepta works in that gap.
Individual Reasoning Capture
Before group discussion shapes what gets said, each decision-maker's real view is captured independently, what they believe, what they're uncertain about, and what they're not saying out loud.
Structured Scoring
Opinions vary; the scoring doesn't. Every input is assessed against the same analytical framework, so the result reflects the decision, not the room dynamic or who spoke last.
Decision Stability Engine
Individual views are synthesized into a single picture, where the team's reasoning holds, and where it doesn't. That's the moment a hidden risk becomes a visible one, before the decision is locked in.
How It Works
Most decision risk enters before the discussion starts. iXZepta works before, during, and after, so nothing critical stays hidden.
Define Context
The team explicitly frames the decision at hand; scope, constraints, time horizon, and key uncertainties.
Independent Inputs
Participants respond individually and anonymously to structured, decision-specific questions (15–25 min).
Visual Analysis
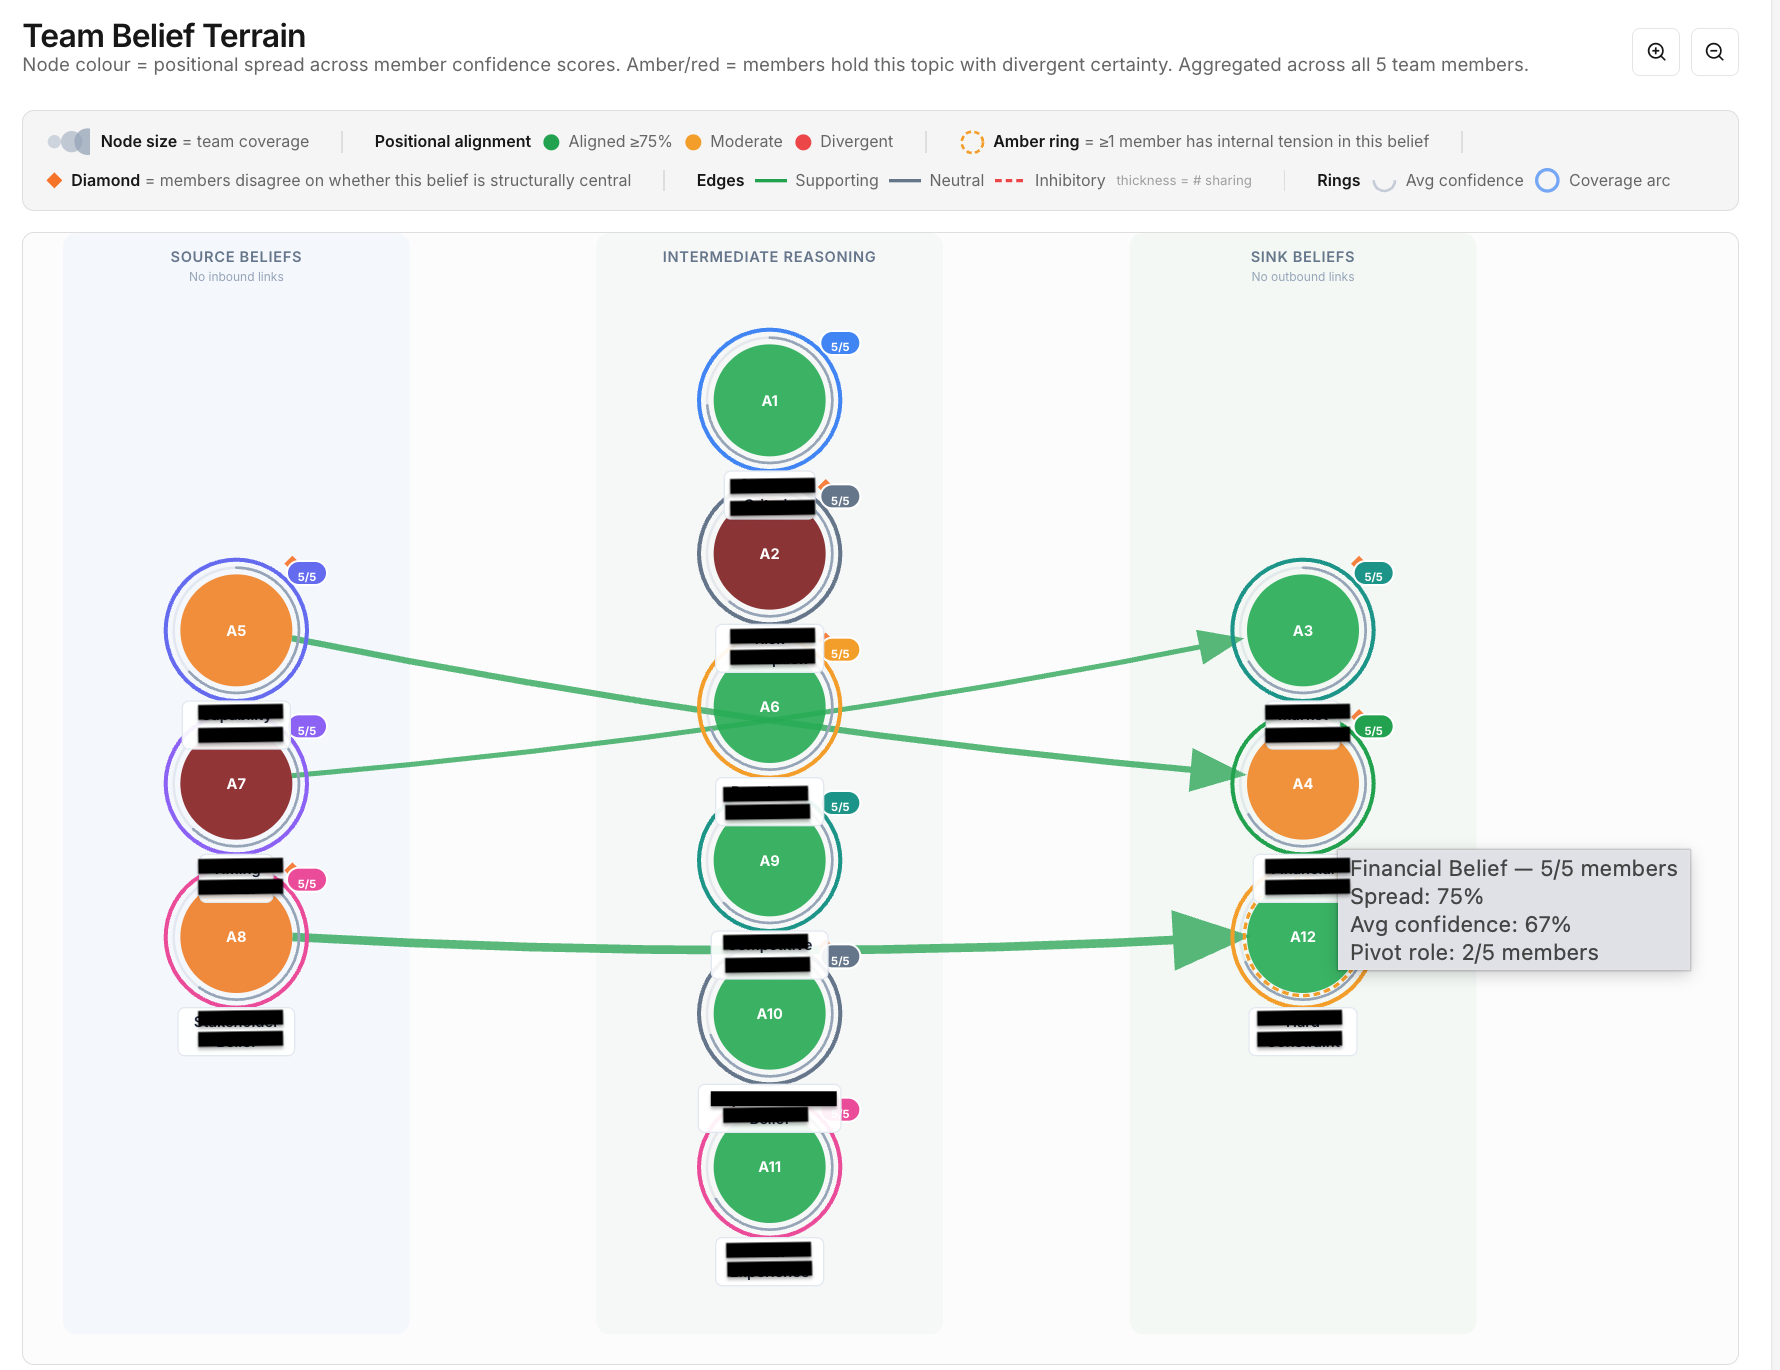
iXZepta converts assumptions and risks into visual maps showing alignment, divergence, and blind spots.
Focused Debate
The debate focuses on assumptions, logic, and unresolved uncertainty; not hierarchy or rhetoric.
Team Divergence Graph
Shows who is structurally aligned, who diverges, and where hidden tensions exist inside the decision model
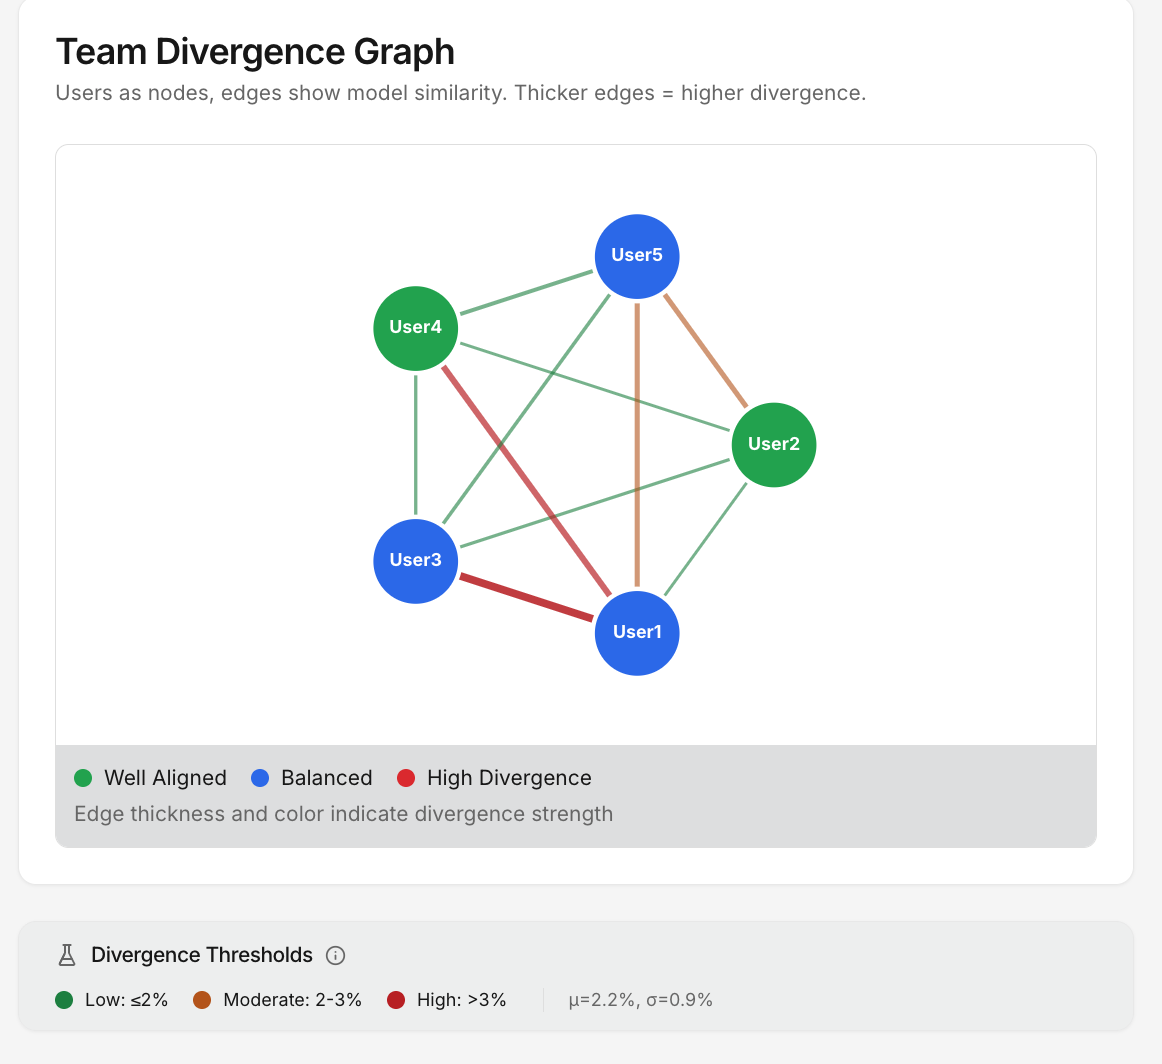
Here we see 5 decision-makers, 3 with a balanced mental model (blue) and 2 with high alignment in their thinking models (green). The red lines between some of them indicate the highest differences and potential tensions between these decision-makers
The divergence graph is the who-and-how-much signal; it shows where the highest differences and potential tensions sit across decision-makers, and on which belief categories those disagreements cluster.